Skrevet av Emne: Klimabløffen  (Lest 52769 ganger)

Utlogget Profeten

  • Erfaren bruker
  • ****
  • Innlegg: 389
  • Honnør: 114
  • Utlogget Utlogget

    Innlegg: 389

Sv: Klimabløffen
« #90 : 18. desember 2009, 17:30 »
Om klimaforandringene er menneskeskapte eller ikke, skal ikke jeg uttale meg bastant om, heller ikke om rapportene som legges frem er overdrevne eller ikke. Men det må så snart som mulig skje en endring i bruk av energikilder. Vi er ikke skapt for å puste inn alle utslipp som kommer fra industri eller drivstoff, antall personer med astma og andre lungesykdommer kommer garantert til å fortsatt øke.

Samtidig er det ikke lett å få enkeltpersoner til å forurense mindre heller. Vi i vesten vil helst ikke gi slipp på alle vaner vi har lagt til oss som gjør hverdagen enklere, og bilbruken i Kina og India øker dramatisk til tross for at både vi i her og i asiatiske land vet at forurensingen øker. Et av poengene til Arnold har vært at vi ikke skal bytte vekk SUV'en fordi den forurenser, men at vi skal kjøre en SUV som ikke gjør det. Skal vi bruke mer kollektiv-trafikk må tilbudet være rimelig, effektivt og lett tilgjengelig. Skal vi sykle til jobb, må det finnes gode sykkelstier osv. Det må legges til rette for at mennesker skal gi slipp på komforten de er vant til. Vi bør bruke store ressurser på forskning på fornybar energi fremover, det er tross alt det som skal løse problemet

Utlogget Hellbouncer

Sv: Klimabløffen
« #91 : 18. desember 2009, 17:44 »

Kilde på at Co2 påvirker klimaet: her
Temperaturforandringer er normalt ja, farlig er det - vi kjenner jo alle til istidene, som du korrekt nevner (på en måte) vi b.la hadde i middelalderen. I en viss grad. Det at noe lignende har skjedd før betyr ikke at det ikke kan farlig. Bare fordi jeg selv har opplevd et jordskjelv uten å ha blitt skadet betyr ikke at jordskjelv er en potensiell naturkatastrofe. Isbjørner? Hva i alle dager prater du om? Opphengt i Al Gore igjen? Så på grafene ja, skjønner ikke det at middelnivået stiger lineært er et argument mot menneskeskapte klimandringer.


Alle er enig om at drivhuseffekten er reel. H2O og CO2 gjør at ikke all varmen blir reflektert ut i rommet igjen. Mer CO2 gjør at mer varme blir holdt inne, det blir varmere. Dette er en såkaldt positiv forsterkning. Det som er uenighet om er hva som forårsaker hva. Varmere luft holder mæmlig mer CO2, så varme perioder har alltid høyere CO2 i luften. Dette kan undersøkes i polar is. Den grafen i wikipedia kilden din er bare tull. På 1000-tallet var det varmere enn nå, det har de ikke tatt med i den.
Die trying

Utlogget Coincidence theorist

  • Aktivt medlem
  • ***
  • Innlegg: 237
  • Honnør: 51
  • Utlogget Utlogget

  • Kjønn: Mann
  • Innlegg: 237

Sv: Klimabløffen
« #92 : 18. desember 2009, 17:45 »
Kilder på at de mener at navnene deres har blitt musbrukt? Hvordan vet du at de 30 000 forskerene dine ikke er offer for det samme? Hva med summen av verdens vitenskapsakademi, de tar feil de da? Dette her blir idiotisk når du bare kaster om deg med påstander.

Kilde på at Co2 påvirker klimaet: her
Temperaturforandringer er normalt ja, farlig er det - vi kjenner jo alle til istidene, som du korrekt nevner (på en måte) vi b.la hadde i middelalderen. I en viss grad. Det at noe lignende har skjedd før betyr ikke at det ikke kan farlig. Bare fordi jeg selv har opplevd et jordskjelv uten å ha blitt skadet betyr ikke at jordskjelv er en potensiell naturkatastrofe. Isbjørner? Hva i alle dager prater du om? Opphengt i Al Gore igjen? Så på grafene ja, skjønner ikke det at middelnivået stiger lineært er et argument mot menneskeskapte klimandringer.

Du sier jeg bare har lest noe, og ikke undersøkt selv - vel jeg tror det gjelder deg også. Forskjellen fra oss er at du ikke har bevegd deg ut fra diverse obskure konspirasjonssider på internett.

Nei, om dere ikke lar dere overbevise av verdens fremste forskere, representert i forskningsakademi i G8 landene så klarer vel neppe jeg det heller. Utrolig at dere rasjonaliserer det å heller tro på noen obskure internett-konspirasjonsteori helter, men slik er det vel. Ikke rart det fins ekstremister innen religioner som Islam etc når folk er så lettpåvirkelige. Kos dere med konspirasjonsteoriene håper inderlig ikke det er så mange av dere her i verden - spesielt ikke blandt de som tar viktige beslutninger.

Jeg trenger bare si CLIMATEGATE så er hele forskningen du sikter til debunked.... korrupsjonen og løgnene er avslørt... hvis de fremste forskerene som du kaller dem brukte tall og grafer som de selv har lagd og som de selv innrømmer i mailsene er gale, hvordan kan du henvise til det tullet??? Du lener deg mot junk science !!!! Det hjelper ikke å si konspirasjonsteori hele tiden, og tro det er alt du trenger å si, så har du vunnet diskusjonen...  Du tror på løgnene selv om de har blitt bevist og brakt frem i lyset... det er ikke håp for deg, du er blitt hjernevasket til de grader
\\\\\\\"If many people believe that something is true most of us never second guess and automatically accept it as the truth\\\\\\\"

Utlogget .......1

  • Forumavhengig
  • ******
  • Innlegg: 701
  • Honnør: 552
  • Utlogget Utlogget

  • Kjønn: Mann
  • Innlegg: 701

Sv: Klimabløffen
« #93 : 18. desember 2009, 17:55 »
Denne gangen holder jeg med Coincidence theorist, selv om jeg er uenig i alle de andre påstandene han har kommet med på forumet. Nå fikk du til og med et honnør av meg. Tongue

Utlogget Coincidence theorist

  • Aktivt medlem
  • ***
  • Innlegg: 237
  • Honnør: 51
  • Utlogget Utlogget

  • Kjønn: Mann
  • Innlegg: 237

Sv: Klimabløffen
« #94 : 18. desember 2009, 18:13 »
i denne videoen får du demonstrert at co2 henger etter varmen. Det er varmen som går opp først i grafen, også følger co2 deretter etter. Temperaturen leder over Co2 med over 800 år.

http://www.youtube.com/watch?v=uP1Q-0fdkWI

\\\\\\\"If many people believe that something is true most of us never second guess and automatically accept it as the truth\\\\\\\"

Utlogget Unknown_Soldier

  • Treningsnarkoman
  • *******
  • Innlegg: 2 863
  • Honnør: 1248
  • Utlogget Utlogget

    Innlegg: 2 863

Sv: Klimabløffen
« #95 : 18. desember 2009, 18:20 »
i denne videoen får du demonstrert at co2 henger etter varmen. Det er varmen som går opp først i grafen, også følger co2 deretter etter. Temperaturen leder over Co2 med over 800 år.

http://www.youtube.com/watch?v=uP1Q-0fdkWI


DU anklager andre for dårlige kilder, og henviser til FOX news? Hahaha
Sa brura

Utlogget Unknown_Soldier

  • Treningsnarkoman
  • *******
  • Innlegg: 2 863
  • Honnør: 1248
  • Utlogget Utlogget

    Innlegg: 2 863

Sv: Klimabløffen
« #96 : 18. desember 2009, 18:21 »
Om klimaforandringene er menneskeskapte eller ikke, skal ikke jeg uttale meg bastant om, heller ikke om rapportene som legges frem er overdrevne eller ikke. Men det må så snart som mulig skje en endring i bruk av energikilder. Vi er ikke skapt for å puste inn alle utslipp som kommer fra industri eller drivstoff, antall personer med astma og andre lungesykdommer kommer garantert til å fortsatt øke.

Samtidig er det ikke lett å få enkeltpersoner til å forurense mindre heller. Vi i vesten vil helst ikke gi slipp på alle vaner vi har lagt til oss som gjør hverdagen enklere, og bilbruken i Kina og India øker dramatisk til tross for at både vi i her og i asiatiske land vet at forurensingen øker. Et av poengene til Arnold har vært at vi ikke skal bytte vekk SUV'en fordi den forurenser, men at vi skal kjøre en SUV som ikke gjør det. Skal vi bruke mer kollektiv-trafikk må tilbudet være rimelig, effektivt og lett tilgjengelig. Skal vi sykle til jobb, må det finnes gode sykkelstier osv. Det må legges til rette for at mennesker skal gi slipp på komforten de er vant til. Vi bør bruke store ressurser på forskning på fornybar energi fremover, det er tross alt det som skal løse problemet

Veldig bra.
Sa brura

Utlogget Unknown_Soldier

  • Treningsnarkoman
  • *******
  • Innlegg: 2 863
  • Honnør: 1248
  • Utlogget Utlogget

    Innlegg: 2 863

Sv: Klimabløffen
« #97 : 18. desember 2009, 18:24 »
her tar professor Bob Carter opp de vitenskapelige argumentene


Bob Carter:

Carter is a former Director of Australia's Secretariat for the Ocean Drilling Program and a Co-Chief Scientist for drilling leg 181..

Riight, han har jobbet som Direktøren for Australias oljedrilling program.

However, he is on the research committee of the Institute of Public Affairs, a right-wing group that has received funding from corporate interests including oil and tobacco companies.[


Kjempebra kilde..
Sa brura

Utlogget Coincidence theorist

  • Aktivt medlem
  • ***
  • Innlegg: 237
  • Honnør: 51
  • Utlogget Utlogget

  • Kjønn: Mann
  • Innlegg: 237

Sv: Klimabløffen
« #98 : 18. desember 2009, 18:25 »
DU anklager andre for dårlige kilder, og henviser til FOX news? Hahaha

har vist den grafen før gjennom andre kilder, men noen gidder ikke lese gjennom derfor viser jeg den på film, noen liker film bedre Smiley
\\\\\\\"If many people believe that something is true most of us never second guess and automatically accept it as the truth\\\\\\\"

Utlogget Unknown_Soldier

  • Treningsnarkoman
  • *******
  • Innlegg: 2 863
  • Honnør: 1248
  • Utlogget Utlogget

    Innlegg: 2 863

Sv: Klimabløffen
« #99 : 18. desember 2009, 18:28 »
har vist den grafen før gjennom andre kilder, men noen gidder ikke lese gjennom derfor viser jeg den på film, noen liker film bedre Smiley

Henger du mye på Nyhetsspeilet eller?
Du er jo helt retarded. Du anklager andre for juks og fusk, når dine egne kilder og "helter" åpenbart har like mange interessekonflikter som de du anklager for fusk. Hvordan kan du være så skråsikker? Det vitner desverre om personlighetsforstyrrelse. Du er klar over at du er en ekstremist, ikke sant? Og du vet at ting aldri er svart hvitt. Ekstremister tar ALLTID feil.
Sa brura

Utlogget Coincidence theorist

  • Aktivt medlem
  • ***
  • Innlegg: 237
  • Honnør: 51
  • Utlogget Utlogget

  • Kjønn: Mann
  • Innlegg: 237

Sv: Klimabløffen
« #100 : 18. desember 2009, 18:35 »
Bla nedover på denne siden så kan du gå gjennom vitenskapen selv, har linket til dette før men du liker helle å angripe en person enn å se på vitenskapen.

http://www.oism.org/pproject/s33p36.htm


Arthur B. Robinson, Noah E. Robinson, and Willie Soon

Oregon Institute of Science and Medicine, 2251 Dick George Road, Cave Junction, Oregon 97523 [artr@oism.org]


ABSTRACT

A review of the research literature concerning the environmental consequences of increased levels of atmospheric carbon dioxide leads to the conclusion that increases during the 20th and early 21st centuries have produced no deleterious effects upon Earth's weather and climate. Increased carbon dioxide has, however, markedly increased plant growth. Predictions of harmful climatic effects due to future increases in hydrocarbon use and minor greenhouse gases like CO2 do not conform to current experimental knowledge. The environmental effects of rapid expansion of the nuclear and hydrocarbon energy industries are discussed.


SUMMARY

Political leaders gathered in Kyoto, Japan, in December 1997 to consider a world treaty restricting human production of "greenhouse gases," chiefly carbon dioxide (CO2). They feared that CO2 would result in "human-caused global warming" – hypothetical severe increases in Earth's temperatures, with disastrous environmental consequences. During the past 10 years, many political efforts have been made to force worldwide agreement to the Kyoto treaty.

When we reviewed this subject in 1998 (1,2), existing satellite records were short and were centered on a period of changing intermediate temperature trends. Additional experimental data have now been obtained, so better answers to the questions raised by the hypothesis of "human-caused global warming" are now available.


Figure 1: Surface temperatures in the Sargasso Sea, a 2 million square mile region of the Atlantic Ocean, with time resolution of 50 to 100 years and ending in 1975, as determined by isotope ratios of marine organism remains in sediment at the bottom of the sea (3). The horizontal line is the average temperature for this 3,000-year period. The Little Ice Age and Medieval Climate Optimum were naturally occurring, extended intervals of climate departures from the mean. A value of 0.25 °C, which is the change in Sargasso Sea temperature between 1975 and 2006, has been added to the 1975 data in order to provide a 2006 temperature value.
The average temperature of the Earth has varied within a range of about 3°C during the past 3,000 years. It is currently increasing as the Earth recovers from a period that is known as the Little Ice Age, as shown in Figure 1. George Washington and his army were at Valley Forge during the coldest era in 1,500 years, but even then the temperature was only about 1° Centigrade below the 3,000-year average.


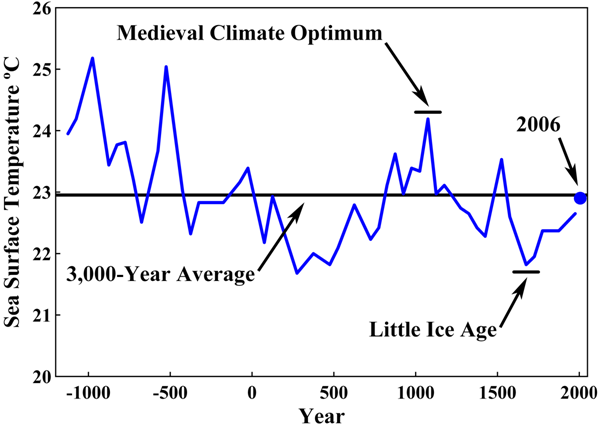
Figure 2: Average length of 169 glaciers from 1700 to 2000 (4). The principal source of melt energy is solar radiation. Variations in glacier mass and length are primarily due to temperature and precipitation (5,6). This melting trend lags the temperature increase by about 20 years, so it predates the 6-fold increase in hydrocarbon use (7) even more than shown in the figure. Hydrocarbon use could not have caused this shortening trend.
The most recent part of this warming period is reflected by shortening of world glaciers, as shown in Figure 2. Glaciers regularly lengthen and shorten in delayed correlation with cooling and warming trends. Shortening lags temperature by about 20 years, so the current warming trend began in about 1800.


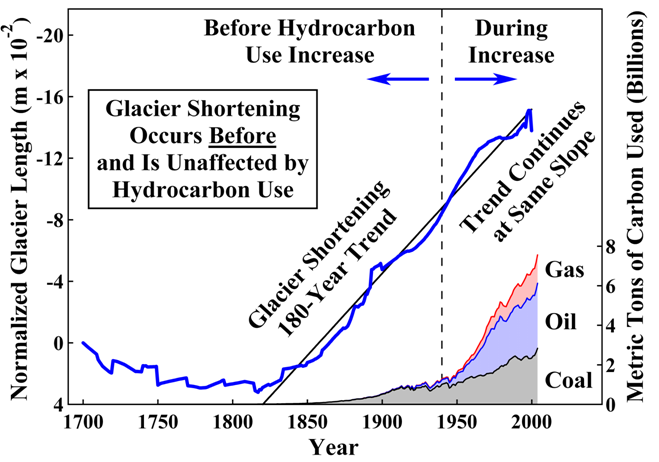
Figure 3: Arctic surface air temperature compared with total solar irradiance as measured by sunspot cycle amplitude, sunspot cycle length, solar equatorial rotation rate, fraction of penumbral spots, and decay rate of the 11-year sunspot cycle (8,9). Solar irradiance correlates well with Arctic temperature, while hydrocarbon use (7) does not correlate.
Atmospheric temperature is regulated by the sun, which fluctuates in activity as shown in Figure 3; by the greenhouse effect, largely caused by atmospheric water vapor (H2O); and by other phenomena that are more poorly understood. While major greenhouse gas H2O substantially warms the Earth, minor greenhouse gases such as CO2 have little effect, as shown in Figures 2 and 3. The 6-fold increase in hydrocarbon use since 1940 has had no noticeable effect on atmospheric temperature or on the trend in glacier length.

While Figure 1 is illustrative of most geographical locations, there is great variability of temperature records with location and regional climate. Comprehensive surveys of published temperature records confirm the principal features of Figure 1, including the fact that the current Earth temperature is approximately 1 °C lower than that during the Medieval Climate Optimum 1,000 years ago (11,12).


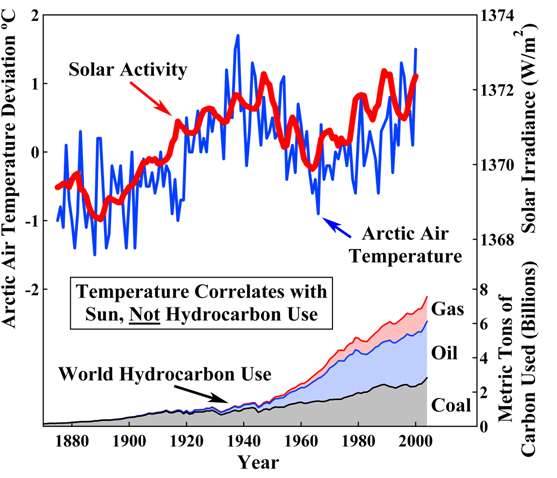
Figure 4: Annual mean surface temperatures in the contiguous United States between 1880 and 2006 (10). The slope of the least-squares trend line for this 127-year record is 0.5 ºC per century.
Surface temperatures in the United States during the past century reflect this natural warming trend and its correlation with solar activity, as shown in Figures 4 and 5. Compiled U.S. surface temperatures have increased about 0.5 °C per century, which is consistent with other historical values of 0.4 to 0.5 °C per century during the recovery from the Little Ice Age (13-17). This temperature change is slight as compared with other natural variations, as shown in Figure 6. Three intermediate trends are evident, including the decreasing trend used to justify fears of "global cooling" in the 1970s.


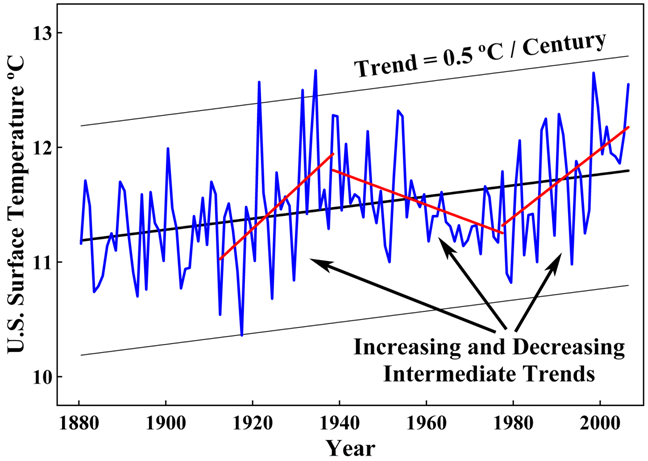
Figure 5: U.S. surface temperature from Figure 4 as compared with total solar irradiance (19) from Figure 3.
Between 1900 and 2000, on absolute scales of solar irradiance and degrees Kelvin, solar activity increased 0.19%, while a 0.5 °C temperature change is 0.21%. This is in good agreement with estimates that Earth's temperature would be reduced by 0.6 °C through particulate blocking of the sun by 0.2% (18).


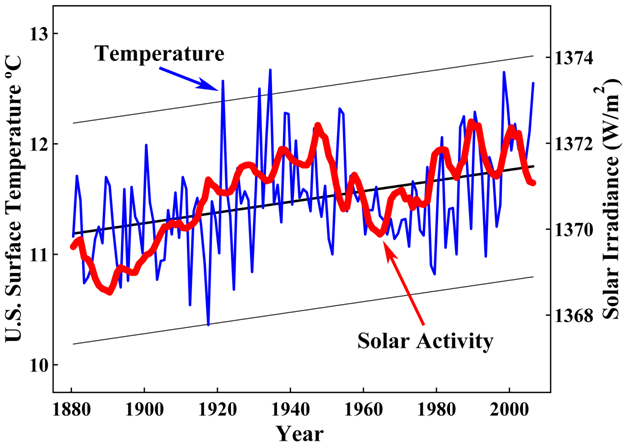
Figure 6: Comparison between the current U.S. temperature change per century, the 3,000-year temperature range in Figure 1, seasonal and diurnal range in Oregon, and seasonal and diurnal range throughout the Earth.
Solar activity and U.S. surface temperature are closely correlated, as shown in Figure 5, but U.S. surface temperature and world hydrocarbon use are not correlated, as shown in Figure 13.

The U.S. temperature trend is so slight that, were the temperature change which has taken place during the 20th and 21st centuries to occur in an ordinary room, most of the people in the room would be unaware of it.


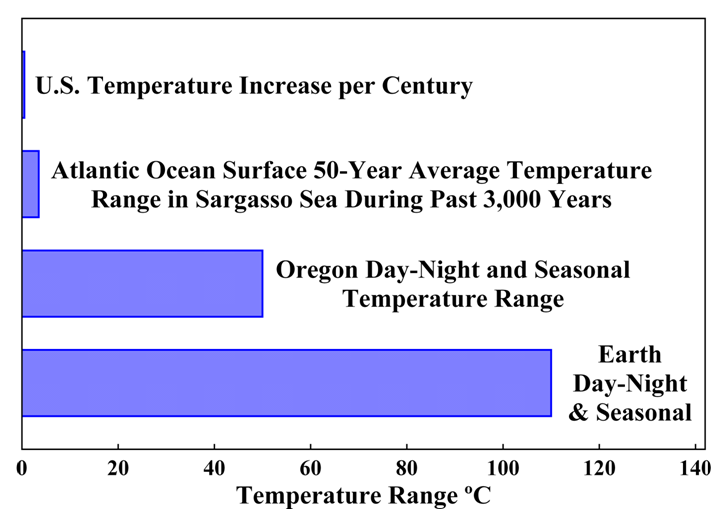
Figure 7: Annual precipitation in the contiguous 48 United States between 1895 and 2006. U.S. National Climatic Data Center, U.S. Department of Commerce 2006 Climate Review (20). The trend shows an increase in rainfall of 1.8 inches per century – approximately 6% per century.
During the current period of recovery from the Little Ice Age, the U.S. climate has improved somewhat, with more rainfall, fewer tornados, and no increase in hurricane activity, as illustrated in Figures 7 to 10. Sea level has trended upward for the past 150 years at a rate of 7 inches per century, with 3 intermediate uptrends and 2 periods of no increase as shown in Figure 11. These features are confirmed by the glacier record as shown in Figure 12. If this trend continues as did that prior to the Medieval Climate Optimum, sea level would be expected to rise about 1 foot during the next 200 years.

As shown in Figures 2, 11, and 12, the trends in glacier shortening and sea level rise began a century before the 60-year 6-fold increase in hydrocarbon use, and have not changed during that increase. Hydrocarbon use could not have caused these trends.


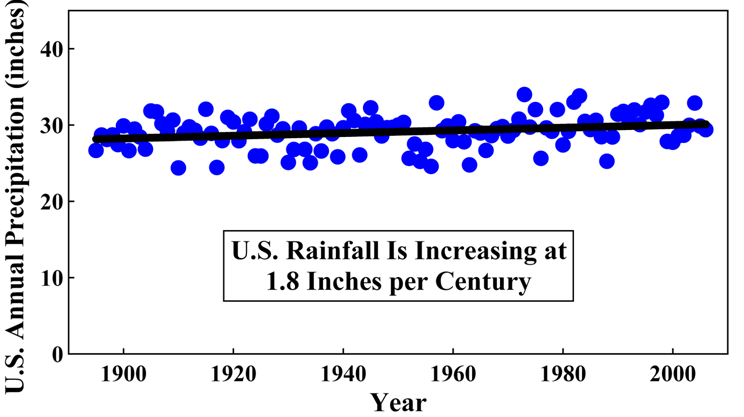
Figure 8: Annual number of strong-to-violent category F3 to F5 tornados during the March-to-August tornado season in the U.S. between 1950 and 2006. U.S. National Climatic Data Center, U.S. Department of Commerce 2006 Climate Review (20). During this period, world hydrocarbon use increased 6-fold, while violent tornado frequency decreased by 43%.
During the past 50 years, atmospheric CO2 has increased by 22%. Much of that CO2 increase is attributable to the 6-fold increase in human use of hydrocarbon energy. Figures 2, 3, 11, 12, and 13 show, however, that human use of hydrocarbons has not caused the observed increases in temperature.

The increase in atmospheric carbon dioxide has, however, had a substantial environmental effect. Atmospheric CO2 fertilizes plants. Higher CO2 enables plants to grow faster and larger and to live in drier climates. Plants provide food for animals, which are thereby also enhanced. The extent and diversity of plant and animal life have both increased substantially during the past half-century. Increased temperature has also mildly stimulated plant growth.


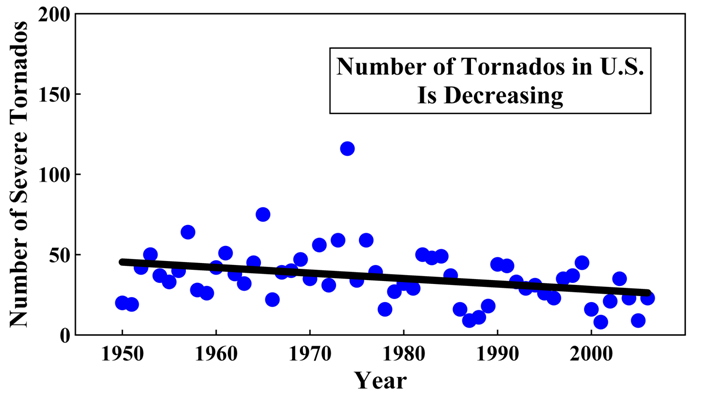
Figure 9: Annual number of Atlantic hurricanes that made landfall between 1900 and 2006 (21). Line is drawn at mean value.
Does a catastrophic amplification of these trends with damaging climatological consequences lie ahead? There are no experimental data that suggest this. There is also no experimentally validated theoretical evidence of such an amplification.

Predictions of catastrophic global warming are based on computer climate modeling, a branch of science still in its infancy. The empirical evidence – actual measurements of Earth's temperature and climate – shows no man-made warming trend. Indeed, during four of the seven decades since 1940 when average CO2 levels steadily increased, U.S. average temperatures were actually decreasing. While CO2 levels have increased substantially and are expected to continue doing so and humans have been responsible for part of this increase, the effect on the environment has been benign.

There is, however, one very dangerous possibility.

Our industrial and technological civilization depends upon abundant, low-cost energy. This civilization has already brought unprecedented prosperity to the people of the more developed nations. Billions of people in the less developed nations are now lifting themselves from poverty by adopting this technology.

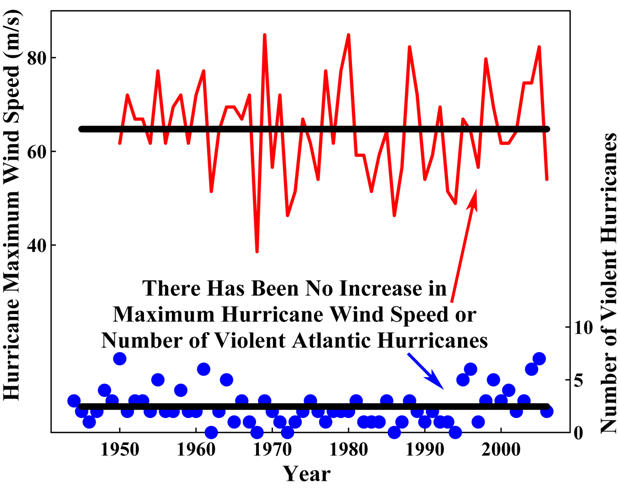
http://www.oism.org/pproject/Slides/Presentation/Slide9.png


Figure 10: Annual number of violent hurricanes and maximum attained wind speed during those hurricanes in the Atlantic Ocean between 1944 and 2006 (22,23). There is no upward trend in either of these records. During this period, world hydrocarbon use increased 6-fold. Lines are mean values.
Hydrocarbons are essential sources of energy to sustain and extend prosperity. This is especially true of the developing nations, where available capital and technology are insufficient to meet rapidly increasing energy needs without extensive use of hydrocarbon fuels. If, through misunderstanding of the underlying science and through misguided public fear and hysteria, mankind significantly rations and restricts the use of hydrocarbons, the worldwide increase in prosperity will stop. The result would be vast human suffering and the loss of hundreds of millions of human lives. Moreover, the prosperity of those in the developed countries would be greatly reduced.


\\\\\\\"If many people believe that something is true most of us never second guess and automatically accept it as the truth\\\\\\\"

Utlogget Unknown_Soldier

  • Treningsnarkoman
  • *******
  • Innlegg: 2 863
  • Honnør: 1248
  • Utlogget Utlogget

    Innlegg: 2 863

Sv: Klimabløffen
« #101 : 18. desember 2009, 18:51 »
Du kan ikke bare poste en hel vitenskaplig artikkel og regne med at folk skal forstå den. Du som har satt deg så godt inn i dette får gå igjennom rapportene og forklare for oss hvorfor det er som det er. Det er jo DU som prøver å overbevise oss, så da får du sette deg ned og skrive ned viktige poenger, understreke, osv, før du bare legger ut ting. Blir absurd.

Hvis ikke kan jo jeg bare linke til en artikkel som sier noe annet, sånn som dette:

Abstract

This chapter assesses the current state of knowledge of the rate of change of global-averaged and regional sea-level in relation to climate change. We focus on the 20th and 21st centuries.
However, because of the slow response to past conditions of the oceans and ice sheets and the consequent land movements, we consider changes in sea level prior to the historical record, and
we also look over a thousand years into the future.

Past changes in sea level

From recent analyses, our conclusions are as follows:

since the Last Glacial Maximum about 20 000 years ago, sea level has risen by over 120 m at locations far from present and former ice sheets, as a result of loss of mass from these ice sheets. There was a rapid rise between 15 000 and 6000 years ago at an average rate of 10 mm/yr.
based on geological data, global average sea level may have risen at an average rate of 0.5 mm/yr over the last 6000 years and at an average rate of 0.1 to 0.2 mm/yr over the last 3000 years.
vertical land movements are still occurring today as a result of these large transfers of mass from the ice sheets to the ocean.
during the last 6000 years, global average sea-level variations on the time scales of a few hundred years and longer are likely to have been less than 0.3 to 0.5 m.
based on tide gauge data, the rate of global average sea-level rise during the 20th century is in the range 1.0 to 2.0 mm/yr, with a central value of 1.5 mm/yr (as with other ranges of uncertainty, it is not implied that the central value is the best estimate).
based on the few very long tide-gauge records, the average rate of sea-level rise has been larger during the 20th century than the 19th century.
no significant acceleration in the rate of sea-level rise during the 20th century has been detected.
there is decadal variability in extreme sea levels but no evidence of widespread increases in extremes other than that associated with a change in the mean.

Factors affecting present day sea level change

Global average sea level is affected by many factors. Our assessment of the most important is as follows.

Ocean thermal expansion leads to an increase in ocean volume at constant mass. Observational estimates of about 1 mm/yr over recent decades are similar to values of 0.7 to 1.1 mm/yr obtained from Atmosphere-Ocean General Circulation Models (AOGCMs) over a comparable period. Averaged over the 20th century, AOGCM simulations result in rates of thermal expansion of 0.3 to 0.7 mm/yr.
The mass of the ocean, and thus sea level, changes as water is exchanged with glaciers and ice caps. Observational and modelling studies of glaciers and ice-caps indicate a contribution to sea-level rise of 0.2 to 0.4 mm/yr averaged over the 20th century.
Climate changes during the 20th century are estimated from modelling studies to have led to contributions of between Ð0.2 and 0.0 mm/yr from Antarctica (the results of increasing precipitation) and 0.0 to 0.1 mm/yr from Greenland (from changes in both precipitation and runoff).
Greenland and Antarctica have contributed 0.0 to 0.5 mm/yr over the 20th century as a result of long term adjustment to past climate changes.
Changes in terrestrial storage of water over the period 1910 to 1990 are estimated to have contributed from Ð1.1 to +0.4 mm/yr of sea-level rise.

The sum of these components indicates a rate of eustatic sea-level rise (corresponding to a change in ocean volume) from 1910 to 1990 ranging from Ð0.8 mm/yr to 2.2 mm/yr, with a central value of 0.7 mm/yr. The upper bound is close to the observational upper bound (2.0 mm/yr), but the central value bound is less than the observational lower bound (1.0 mm/yr), i.e. the sum of components is biased low compared to the observational estimates. The sum of components indicates an acceleration of only 0.2 mm/yr/century, with a range from Ð1.1 to +0.7 mm/yr/century, consistent with observational finding of no acceleration in sea-level rise during the 20th century. The estimated rate of sea-level rise from anthropogenic climate change from 1910 to 1990 (from modelling studies of thermal expansion, glaciers and ice-sheets) ranges from 0.3 to 0.8 mm/yr. It is very likely that 20th century warming has contributed significantly to the observed sea level rise, through thermal expansion of sea water and widespread loss of land ice.

Projected sea-level changes from 1990 to 2100

Projections of components contributing to sea-level change from 1990 to 2100 (this period is chosen for consistency with the IPCC Second Assessment Report), using a range of AOGCMs following the IS92a scenario (including the direct effect of sulphate aerosol emissions) give:

thermal expansion of 0.11 to 0.43 m, accelerating through the 21st century.
a glacier contribution of 0.01 to 0.23 m.
a Greenland contribution of -0.02 to 0.09 m.
an Antarctic contribution of -0.17 to 0.02 m.

Including thawing of permafrost, deposition of sediment, and the ongoing contributions from ice sheets as a result of climate change since the Last Glacial Maximum, we obtain a range of global-average sea-level rise from 0.11 to 0.77 m. This range reflects systematic uncertainties in modelling.

For the 35 SRES scenarios, we project a sea-level rise of 0.09 to 0.88 m for 1990 to 2100, with a central value of 0.48 m. The central value gives an average rate of 2.2 to 4.4 times the rate over the 20th century. If terrestrial storage continued at its present rates, the projections could be changed by -0.21 to 0.11 m. For an average AOGCM, the SRES scenarios give results which differ by 0.02 m or less for the first half of the 21st century. By 2100, they vary over a range amounting to about 50% of the central value. Beyond the 21st century, sea level rise will depend strongly on the emission scenario.

The West Antarctic Ice Sheet (WAIS) has attracted special attention because it contains enough ice to raise sea level by 6 m and because of suggestions that instabilities associated with its being grounded below sea level may result in rapid ice discharge when the surrounding ice shelves are weakened. The range of projections given above makes no allowance for ice-dynamic instability of the WAIS. It is now widely agreed that major loss of grounded ice and accelerated sea-level rise are very unlikely during the 21st century.

Our confidence in the regional distribution of sea level change from AOGCMs is low because there is little similarity between models. However, models agree on the qualitative conclusion that the range of regional variation is substantial compared with the global average sea-level rise. Nearly all models project greater than average rise in the Arctic Ocean and less than average rise in the Southern Ocean.

Land movements, both isostatic and tectonic, will continue through the 21st century at rates which are unaffected by climate change. It can be expected that by 2100 many regions currently experiencing relative sea-level fall will instead have a rising relative sea level.

Extreme high water levels will occur with increasing frequency (i.e. with reducing return period) as a result of mean sea-level rise. Their frequency may be further increased if storms become more frequent or severe as a result of climate change.

Longer term changes

If greenhouse gas concentrations were stabilised, sea level would nonetheless continue to rise for hundreds of years. After 500 years, sea-level rise from thermal expansion may have reached only half of its eventual level, which models suggest may lie within ranges of 0.5 to 2.0 m and 1 to 4 m for CO2 levels twice and four times pre-industrial, respectively.

Glacier retreat will continue and the loss of a substantial fraction of the total glacier mass is likely. Areas that are currently marginally glaciated are most likely to become ice-free.

Ice sheets will continue to react to climate change during the next several thousand years even if the climate is stabilised. Models project that a local annual-average warming of larger than 3°C sustained for millennia would lead to virtually a complete melting of the Greenland ice sheet. For a warming over Greenland of 5.5°C, consistent with mid-range stabilisation scenarios, the
Greenland ice sheet contributes about 3 m in 1000 years. For a warming of 8°C, the contribution is about 6 m, the ice sheet being largely eliminated. For smaller warmings, the decay of the ice sheet would be substantially slower.

Current ice dynamic models project that the WAIS will contribute no more than 3 mm/yr to sea-level rise over the next thousand years, even if significant changes were to occur in the ice shelves. However, we note that its dynamics are still inadequately understood to make firm projections, especially on the longer time scales.

Apart from the possibility of an internal ice dynamic instability, surface melting will affect the long-term viability of the Antarctic ice sheet. For warmings of more than 10°C, simple runoff models predict that an ablation zone would develop on the ice sheet surface. Irreversible disintegration of the WAIS would result because the WAIS cannot retreat to higher ground once its margins are subjected to surface melting and begin to recede. Such a disintegration would take at least a few millennia. Thresholds for total disintegration of the East Antarctic ice sheet by surface melting involve warmings above 20*C, a situation that has not occurred for at least 15 million years and which is far more than predicted by any scenario of climate change currently under consideration.
Sa brura

Utlogget Unknown_Soldier

  • Treningsnarkoman
  • *******
  • Innlegg: 2 863
  • Honnør: 1248
  • Utlogget Utlogget

    Innlegg: 2 863

Sv: Klimabløffen
« #102 : 18. desember 2009, 18:55 »
Arthur B Robinson er dessuten KRISTEN:

"He is a Christian"

Skeptisk.
Sa brura

Utlogget HeatoN85

  • Superavhengig
  • ******
  • Innlegg: 1 027
  • Honnør: 218
  • Utlogget Utlogget

    Innlegg: 1 027

Sv: Klimabløffen
« #103 : 18. desember 2009, 19:04 »
Spørsmålet er hva som skjer når hydrokarbonet akkumuleres i atmosfæren gjennom kvantesekulære solaroide mekanismer. Sammenhengen mellom temperaturøkning og hydrokarbon kan i enkelte tilfeller se omvendt proporsjonal ut, og slik fóre klimaskeptikere, men når først hydrokarbonet akkumuleres og fungerer som en justert lineær aksellerator på de matematiske linjeformlene, så vil man om et par hundre år se hvorfor man burde handlet i tide.
Overvektige med duft fra baken, HEI det er oss, fettbomber i draktelaken.

Utlogget Coincidence theorist

  • Aktivt medlem
  • ***
  • Innlegg: 237
  • Honnør: 51
  • Utlogget Utlogget

  • Kjønn: Mann
  • Innlegg: 237

Sv: Klimabløffen
« #104 : 18. desember 2009, 19:05 »
litt info om Ian clark som er med i denne videoen

Ian D. Clark is a professor in the Department of Earth Sciences at the University of Ottawa (Canada), who has been writing about geoscience and geochemistry since at least 1982.[1] His graduate work in isotope hydrogeology was at the University of Waterloo and the University of Paris.[2] Clark has written numerous articles for the Canadian Journal of Earth Sciences, for over 25 years.[1]

In 2004, Clark wrote a letter to the Editor of the The Hill Times, suggesting a perspective at odds with some scientific publications, saying:

“ That portion of the scientific community that attributes climate warming to CO2 relies on the hypothesis that increasing CO2, which is in fact a minor greenhouse gas, triggers a much larger water vapour response to warm the atmosphere. This mechanism has never been tested scientifically beyond the mathematical models that predict extensive warming, and are confounded by the complexity of cloud formation - which has a cooling effect.[3] ”

In the 2007 UK television documentary "The Great Global Warming Swindle", he argues that changes in global temperature correlate with solar activity, saying "Solar activity of the last hundred years, over the last several hundred years correlates very nicely on a decadal basis, with sea ice and Arctic temperatures

Videoen viser at de fleste av IPPC sine medlemmer ikke er forskere og ikke er enige i det som blir sagt heller. Mange av de såkalte medlemmene er blitt lagt til listen, selv om de ikke ønsker å være del i dette tullet.


http://www.youtube.com/watch?v=xzSzItt6h-s
\\\\\\\"If many people believe that something is true most of us never second guess and automatically accept it as the truth\\\\\\\"

Gå til:  

Disse kosttilskuddene er glemt for mange, men som alle bør ta.

5 digge middager med cottage cheese

Kosthold09.08.2021270

Cottage cheese er blitt en svært populær matvare!
Det er en risiko forbundet med treningen og løftene man utfører
Det finnes så mange gode varianter av middagskaker enn bare karbonadekaker.

5 fordeler med stående leggpress

Trening28.06.202153

Det er mange fordeler med å trene leggene dine. Se her!